The Frame Graph
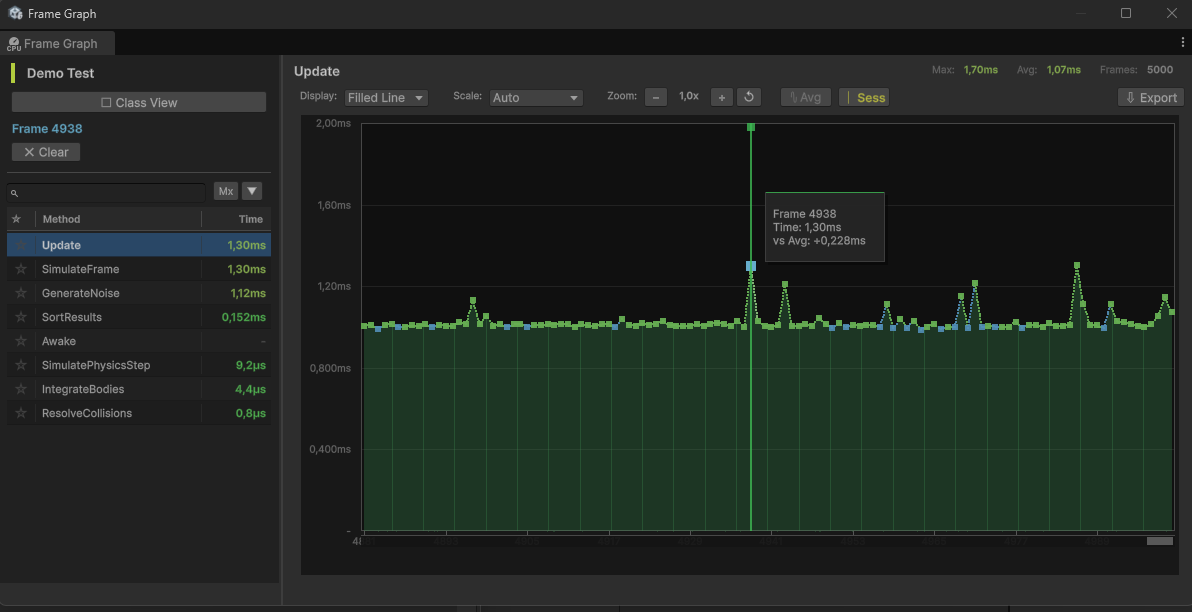
The frame graph is a dedicated window for inspecting a method's per-frame history in detail. Where the profiler window shows one live number per method, the frame graph shows the whole recorded timeline and lets you stop on any single frame.
Opening it
Click a row's History sparkline in the Profiler Window. This freezes a snapshot of the profiler's data and opens the frame graph on that method.
Opening pauses Play Mode
Opening the frame graph pauses the editor and captures a frozen snapshot. The graph keeps showing that snapshot even after you resume the game, so the data you are inspecting will not shift under you.
Layout
- Left panel lists every method in the profiler, with its own search, sort (name, max time, average time, call count), and pinning. Click a method to graph it.
- Graph panel plots the selected method's time per frame, with a value (Y) axis and a frame (X) axis.
Graph modes
In single-method view, a Display dropdown switches between:
- Bars draws one bar per frame.
- Line draws a line through the per-frame values.
- Filled Line draws the line with the area beneath it filled.
Supporting controls:
- Scale sets the time unit (Auto, Milliseconds, or Microseconds).
- Zoom changes how many frames fit on screen; a reset button returns to the default view.
- Avg overlays a moving-average line to see the trend through noisy data.
- Sess shows session markers where measurement sessions began.
Class view
The Class View toggle in the left panel switches to a stacked view of every method in the profiler at once, drawn as a stacked area chart with a color legend beneath the graph. This shows how the frame's total time is divided between methods over time. Right-click a method in the legend to hide it from the stack, and use Show All to bring hidden methods back.
Reading spikes
- Hover a frame to see its exact value.
- Click a bar or frame to select it; the left panel's time column then shows each method's time for that one frame, so you can see what ran during a spike.
- Drag across frames to select a range; the time column then averages each method over that range.
- Use Clear in the left panel to drop the selection and return to viewing max values.
A tall isolated bar is a one-frame spike; a sustained plateau is steady per-frame cost. Switch to class view on a spike frame to see which method caused it.