The Profiler Window
The profiler window is where instrumented methods show up live while you play. Open it from Tools → Profiler Decorator → Profiler Window.
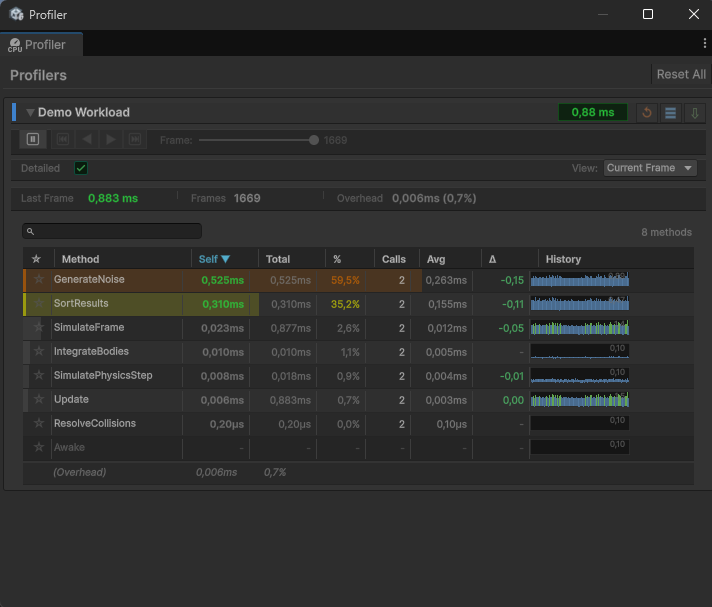
Each [Profile] class (or standalone [Profile] method group) gets its own collapsible box, tagged with the profiler's color and a headline time pill for the frame. Inside the box is a sorted table of methods, worst offenders first.
Play Mode only
Profilers are created when the game runs and the first [Profile] method executes. Before then, the window shows an "Enter Play Mode" message.
The method table
The table is sorted with the slowest method (highest self time) at the top by default, so the frame's worst offender is always the first row. Columns:
| Column | Meaning |
|---|---|
| Star | Pin a method to keep it at the top of the list regardless of sort. |
| Method | The method (or custom [Profile] name). |
| Self | Self time: exclusive, excluding time spent in nested [Profile] calls. |
| Total | Total time: inclusive, including nested [Profile] calls. |
| % | Share of the frame, based on self time. |
| Calls | Number of times the method ran this frame. |
| Avg | Average self time per call. |
| Δ | Change from the previous frame (green is faster, red is slower). |
| History | A per-frame sparkline of this method's time. |
Self vs total time
Self time is what the method spent in its own body. Total time also counts any nested [Profile] methods it called. When a method has a high total but a low self, the cost is in its children; drill down to find the real hot spot. When self and total are close, the method itself is the cost.
Sorting and search
- Click a column header to sort by that column. Click again to flip the direction.
- Search field above the table filters methods by name; the count readout shows how many match.
- The default sort is Self, descending, so the worst offender leads.
View mode
A View dropdown switches the numbers between:
- Current Frame shows the last completed frame's values (the live, per-frame view).
- Max Values shows the peak each method has reached across the session, useful for catching intermittent spikes.
The Detailed toggle controls whether per-method category data is recorded. With it off, the profiler tracks only overall frame time for less overhead.
Overhead readout
The statistics bar reports Overhead: the estimated cost of the instrumentation itself for the frame, in both time and percentage of the frame. Keep an eye on it; if overhead is a large share of the measured time, the numbers for very cheap methods are less trustworthy. This is why excluding trivial methods with [NoProfile] helps.
Per-frame history
Every row's History column draws a live sparkline of that method's recent frames. Click a row's sparkline to open the Frame Graph window, which freezes the data and lets you inspect individual frames.
Per-profiler actions
Each profiler box has icon buttons in its header:
- Reset clears that profiler's accumulated data.
- Log writes a formatted breakdown to the Unity console.
- Export saves the profiler's data to a CSV file.
A Reset All button at the top of the window clears every registered profiler at once.
Pausing to inspect (time travel)
The controls row includes a pause button that freezes Play Mode and lets you step frame by frame through the recorded history with the frame navigation buttons and slider. This is handy for stopping on a spike and reading exactly what ran that frame. Resume to return to live capture.