Getting Started
This page covers installation, the first thing you should see, and how to find every feature.
Install
Profiler Decorator installs through the Unity Package Manager as a git URL.
- In Unity, open Window → Package Manager.
- Click the + button in the top-left and choose Add package from git URL...
- Paste the URL below and click Add:
https://github.com/OverGast/Profiler-Decorator.git?path=Assets/ProfilerDecorator
To pin a specific release instead of tracking the default branch, append a tag to the URL:
https://github.com/OverGast/Profiler-Decorator.git?path=Assets/ProfilerDecorator#v1.0.0
The package id is com.spacewhale.profilerdecorator.
Asset Store
An Asset Store listing is coming soon. Until then, the git URL above is the supported install route.
First look
-
Open any script and add
[Profile]to a method that does real work:using SpaceWhale.ProfilerDecorator; public class TerrainBuilder : MonoBehaviour { [Profile] private void Rebuild() { // ... the work you want to measure ... } } -
Enter Play Mode and make sure the method actually runs.
- Open Tools → Profiler Decorator → Profiler Window.
- Watch a profiler box appear and its method table populate frame by frame.
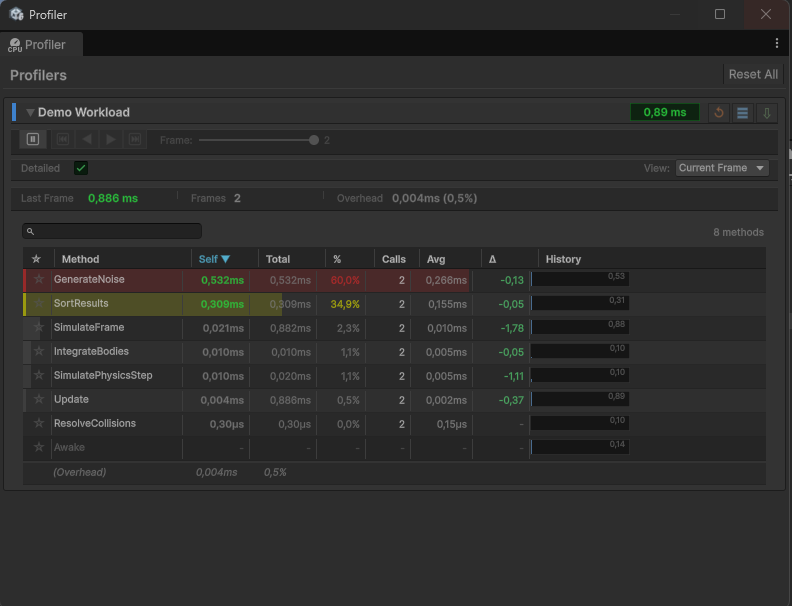
Editor-only measurement
All timing happens in the Editor. The instrumentation bodies are wrapped in #if UNITY_EDITOR, so a player build carries no profiling cost. The [Profile] attribute stays in the compiled assembly as plain metadata (the IL post-processor needs to find it), but it does nothing at runtime in a build.
Finding the controls
| What you want | Where to look |
|---|---|
| Profile a single method | Add [Profile] to the method |
| Profile every method in a class | Add [Profile] to the class |
Exclude one method from a [Profile] class |
Add [NoProfile] to that method |
| Measure a block you cannot annotate (a loop body, part of a method, a third-party call) | The manual Scope API |
| See self vs total time | The Self and Total columns in the method table |
| See per-frame history | The History sparkline column on each row |
| Open the frame graph | Click a row's History sparkline (this pauses Play Mode) |
| Open the profiler window | Tools → Profiler Decorator → Profiler Window |
| Open the welcome / help window | Tools → Profiler Decorator → Welcome |
Troubleshooting
If nothing appears in the window:
- Are you in Play Mode? Profilers are created and populated only while the game runs.
- Is the method actually executing? A
[Profile]method that never gets called produces no data. Confirm the code path runs in Play Mode. - Is
[Profile]on the method or its class? Only annotated methods (or all methods of an annotated class) are measured. A method with[NoProfile], or one in an un-annotated class, is skipped.